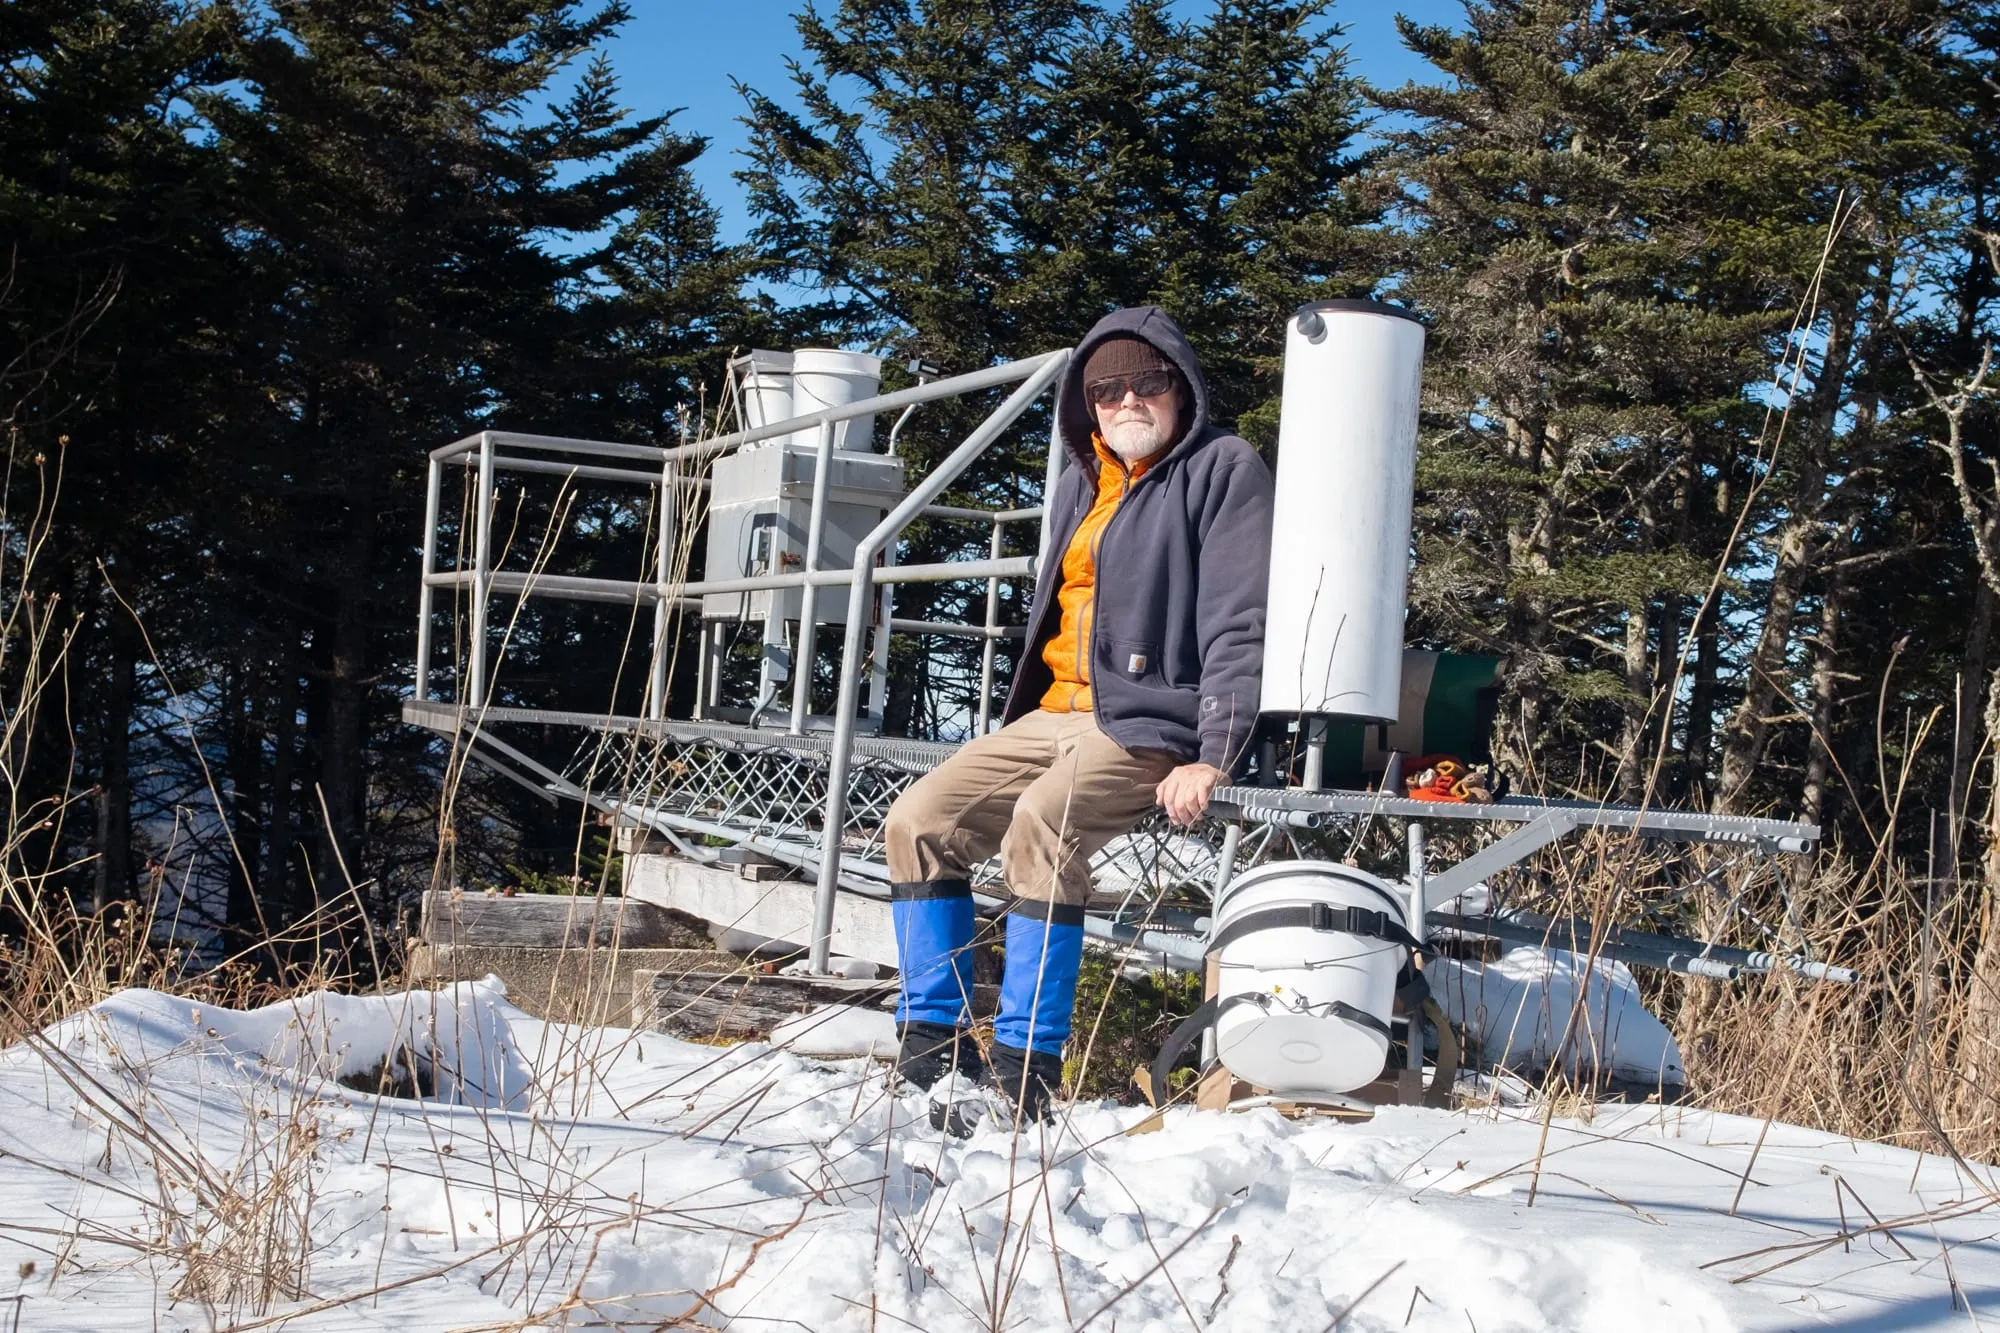

Robin Dreyer has been following the same routine every Tuesday morning for more than a decade.
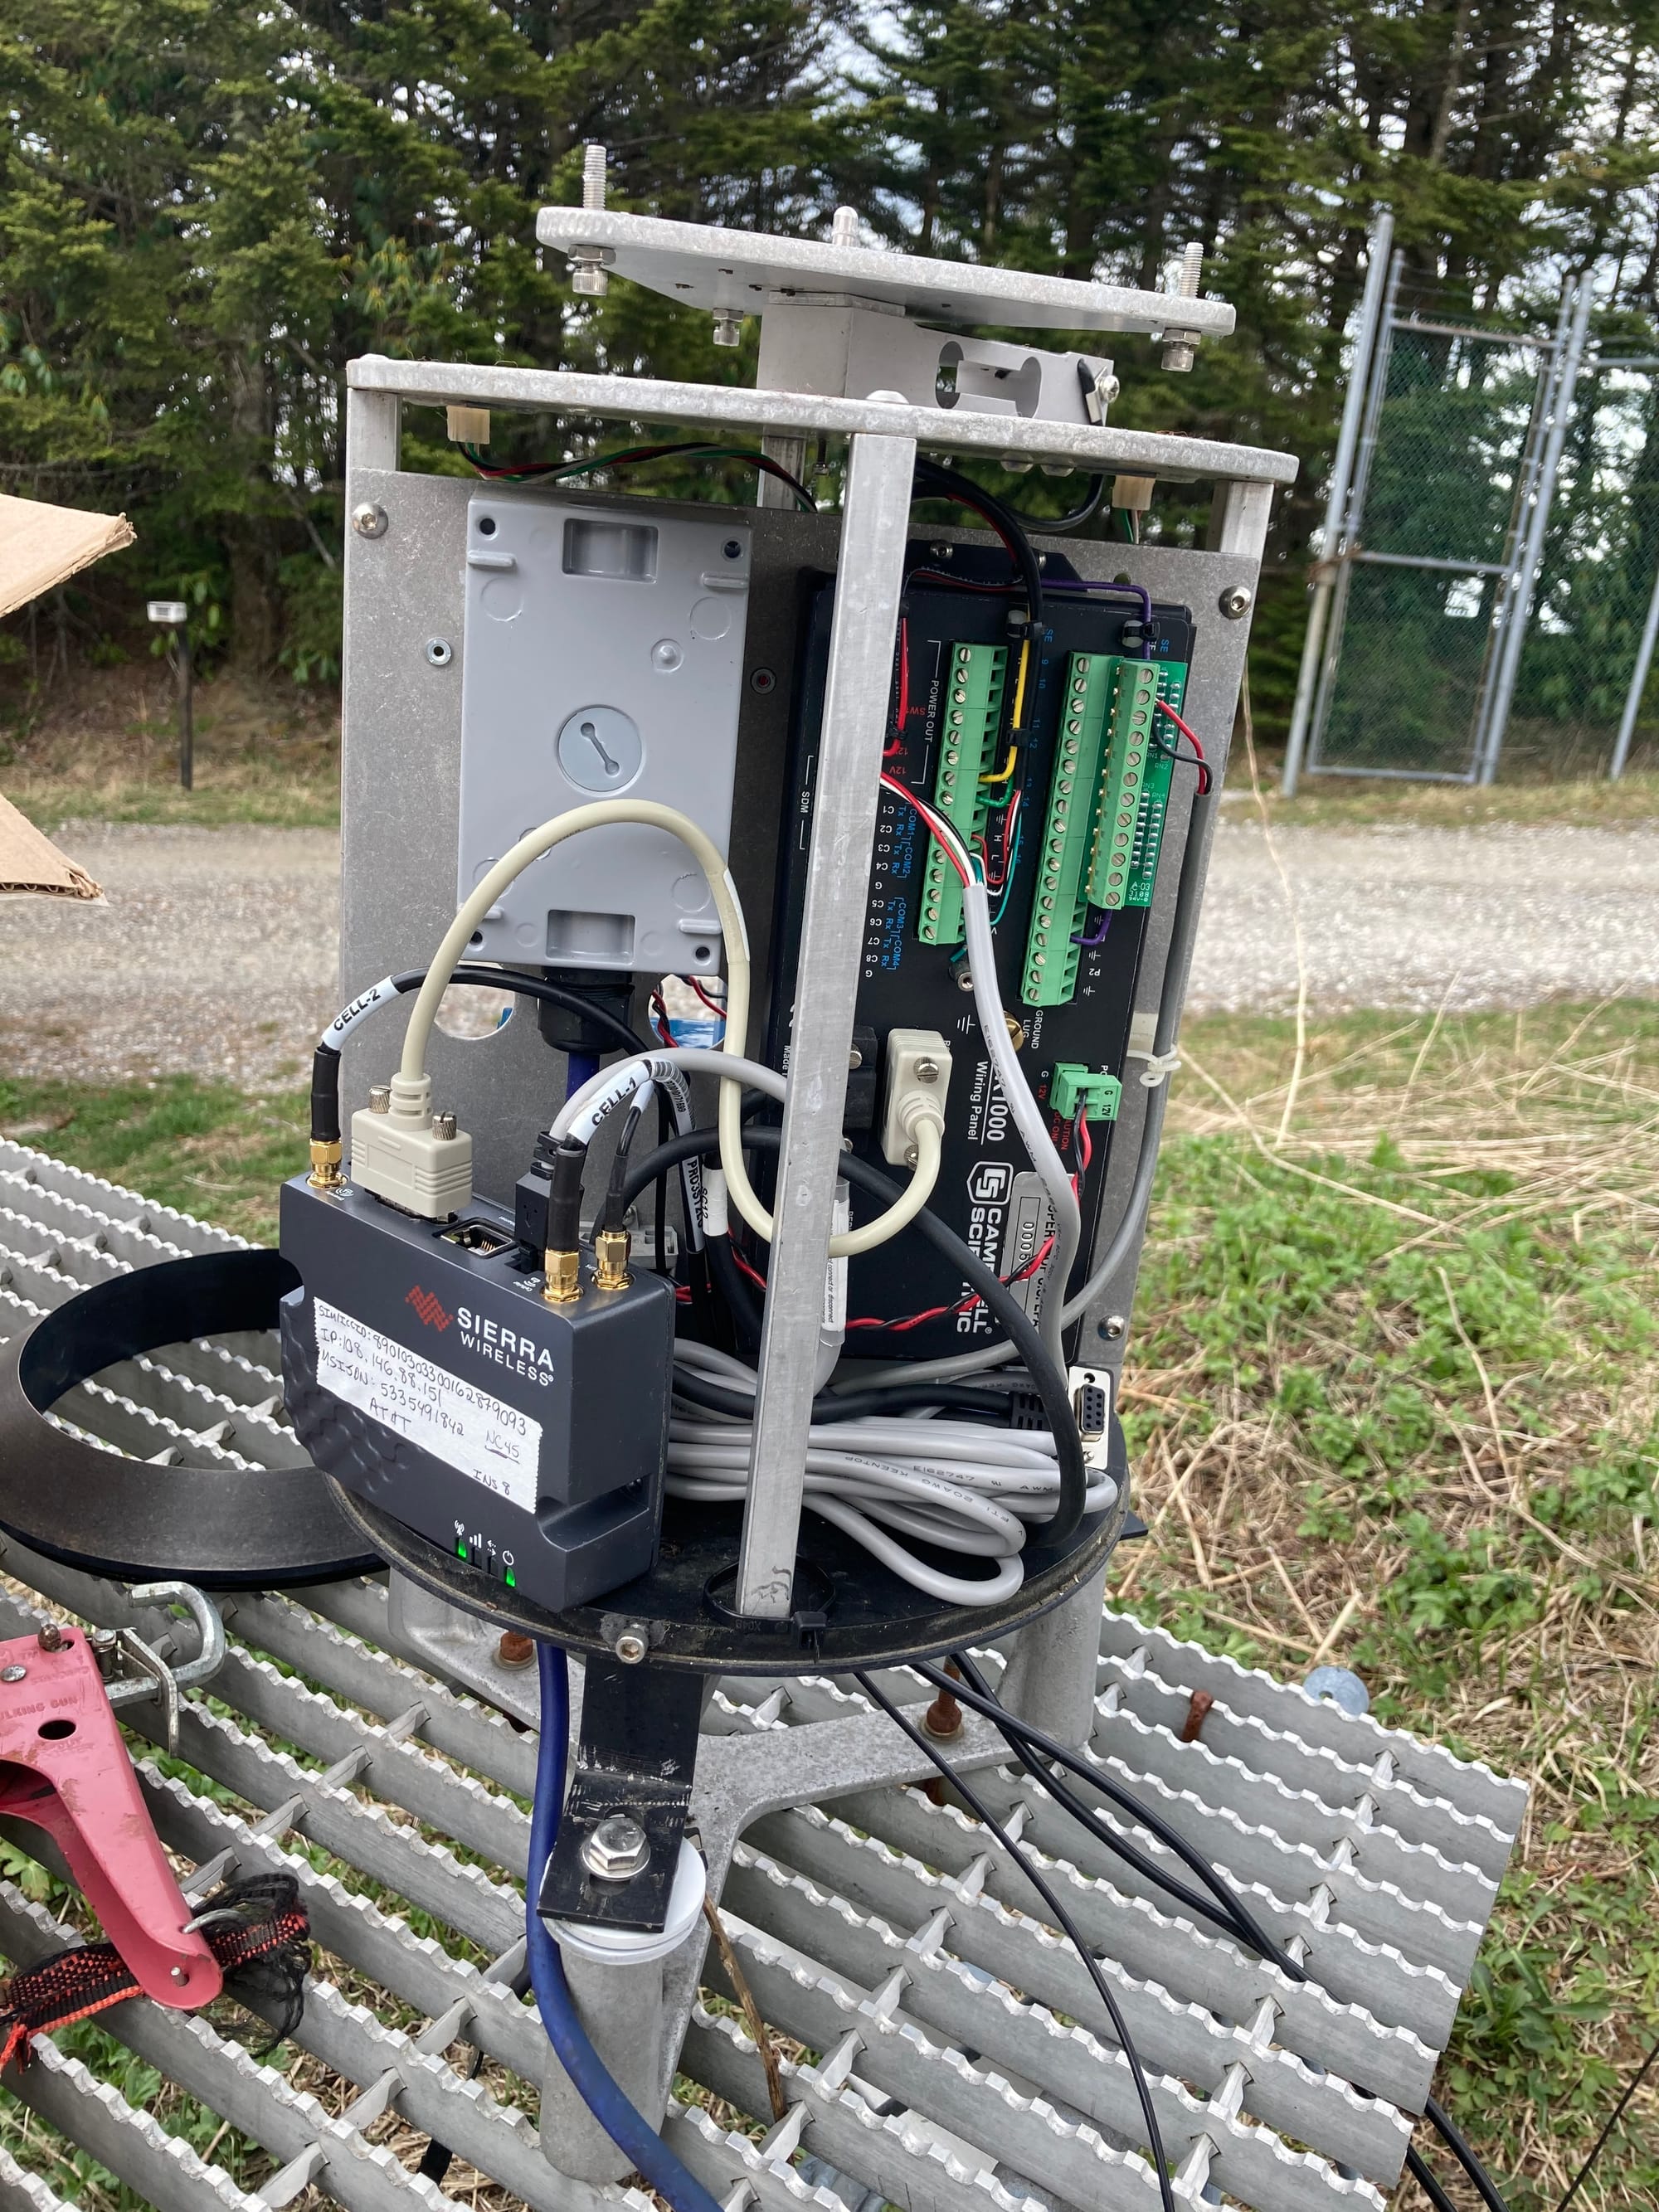
He begins the day with a 16-mile drive to NC45 atop Clingmans’s Peak in North Carolina, a site he monitors. On reaching the gated pathway to the monitoring site, he drives or hikes another mile up the gravel path. He then checks the precipitation bucket, refills his sampling bags, and compares the previous week’s measurements on a digital scale.
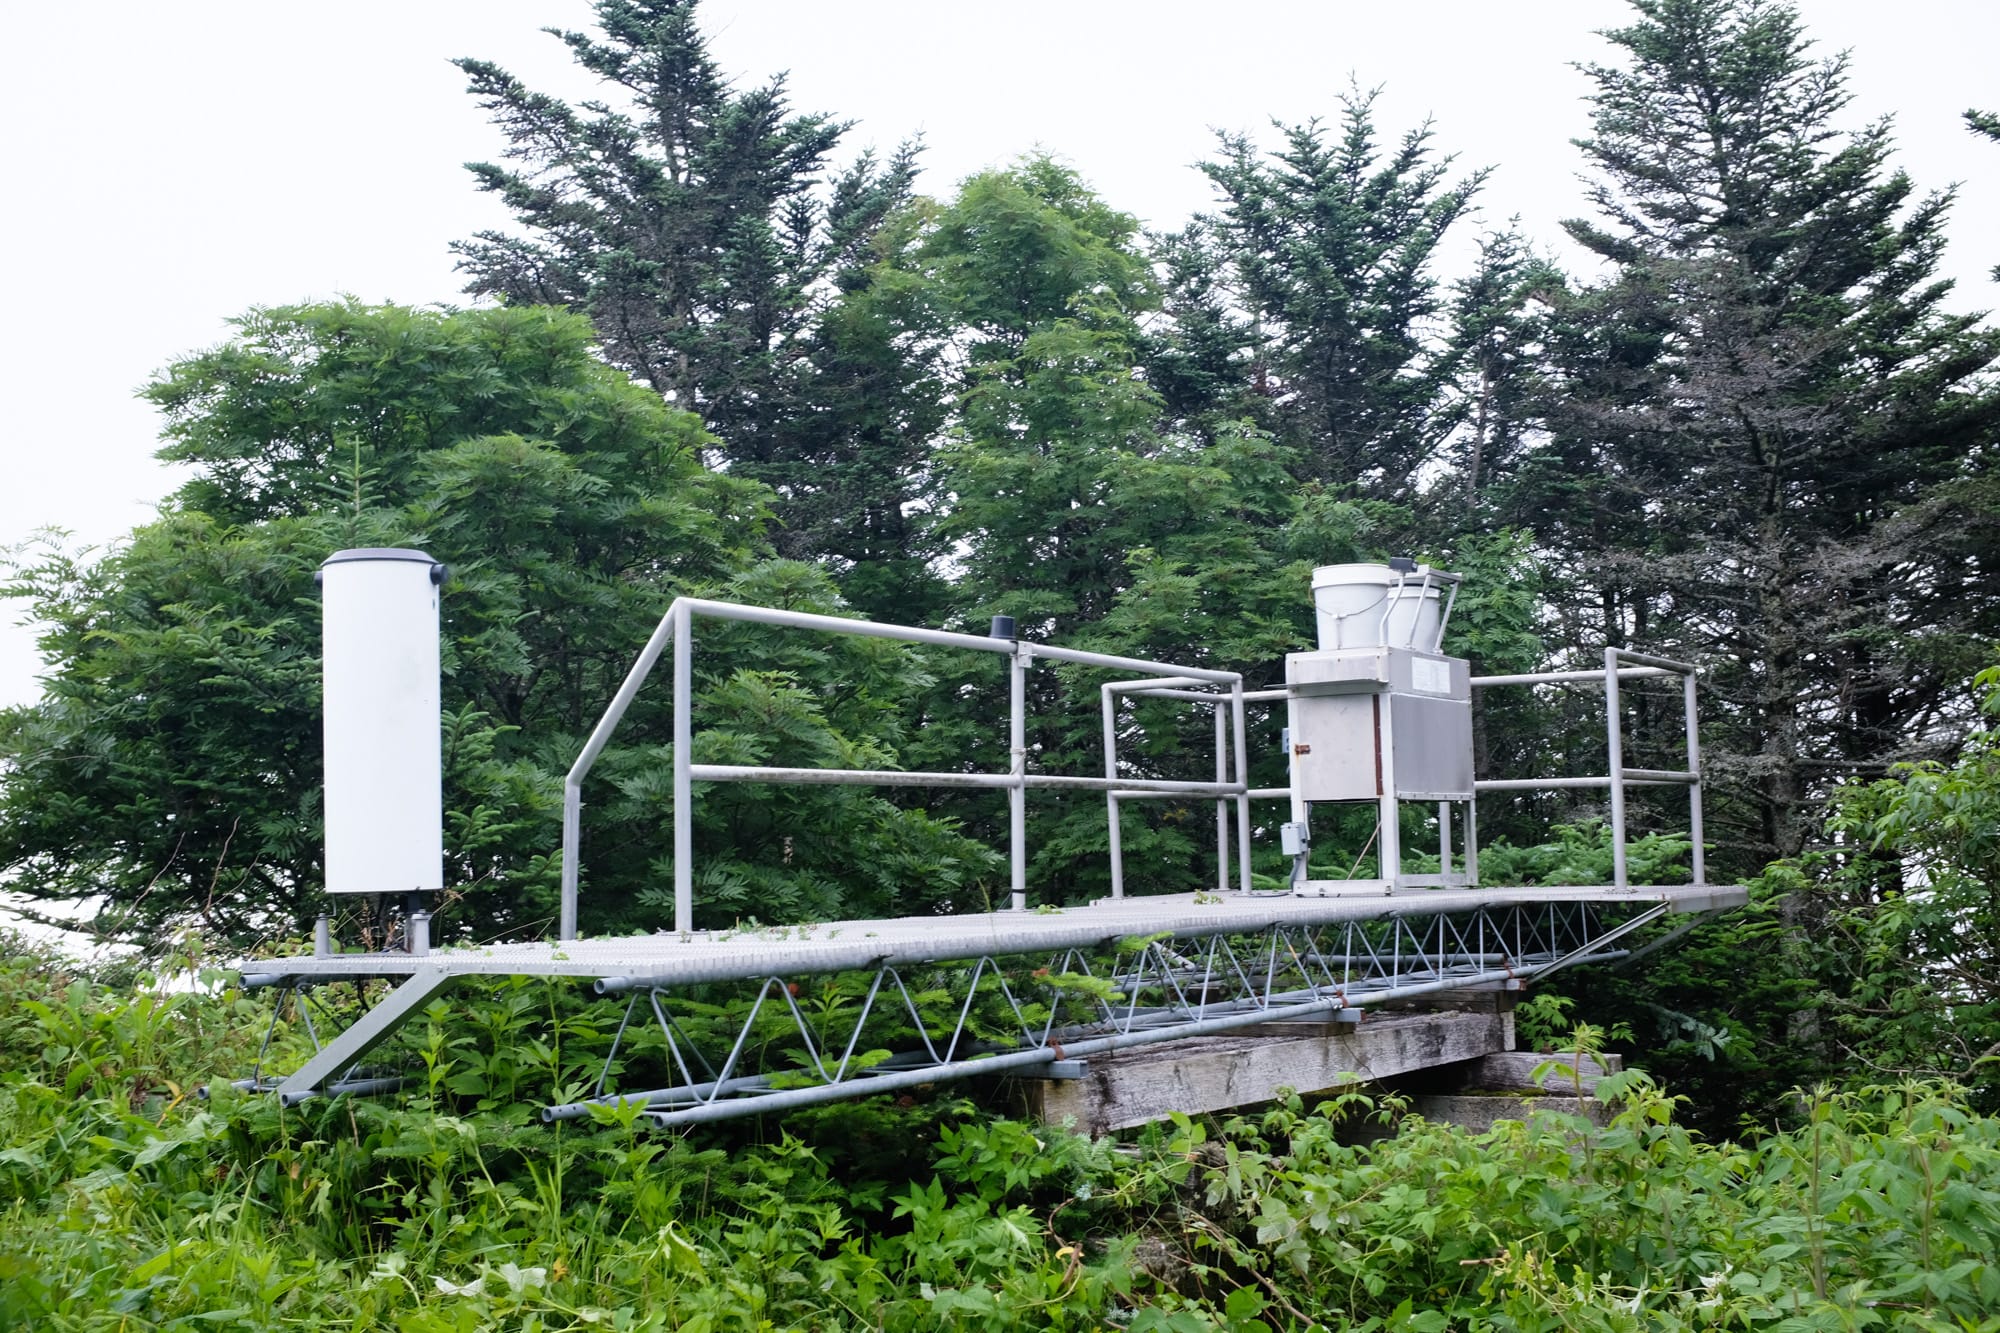
Situated along the state’s Blue Ridge Parkway, NC45 is one of the sites of the National Atmospheric Deposition Program (NADP), the only long-term deposition monitoring program at a national scale. The program studies substances deposited from the atmosphere onto land and water.
The data collected by operators like Dreyer help researchers and institutions track changes in air and water, helping shape policies.
NADP has more than 200 observation sites around the country. The program, introduced in 1978, was originally intended to measure acid rain — the phenomenon of sulfur dioxide (SO2) and nitrogen oxides (NOX) emitted by fossil fuels becoming sulfuric and nitric acids during rains. It was also meant to monitor trends and the distribution of nutrients and other substances found in precipitation.
Now based at the Wisconsin State Laboratory of Hygiene, the observation program is sorted into several networks. The largest is the National Trends Network (NTN), which has collected precipitation data every Tuesday since 1985.
“We measure pH, calcium, magnesium, sodium, and potassium. These can all impact soil and water health,” says NADP principal investigator Sarah Benish. “We also track sulfate, nitrate, chloride, and ammonium, which are fingerprints of sulfur dioxide and nitrogen oxide emissions. Our measurements can help decipher what’s happening on the surface.”
Most of the NTN sites are located in regions, away from pedestrians and wildlife. Some networks measure atmospheric mercury, others measure per- and polyfluoroalkyl substances (PFAS), mercury in fallen leaves, ammonia, and other substances that can affect the environment.
PFAS or ‘forever chemicals’, don’t easily degrade in nature or the human body. Their accumulation has been found to increase people’s risk of cancer and other diseases. These chemicals are prevalent in man-made products such as clothing, food packaging, and other common household goods.
The importance of long-term precipitation monitoring was also recognised in the 1990 amendments to the Clean Air Act, which established a national programme to address acid deposition.
Each of the monitoring networks has its interested parties. “We have a lot of stakeholders that play into the different monitoring networks,” says Benish. “Universities, [the] federal government, state agencies, tribal governments, like that.”
Organizations such as the National Oceanic and Atmospheric Administration (NOAA), the U.S. Department of Agriculture (USDA), the U.S. Forest Service, and the U.S. Environmental Protection Agency (EPA), make use of the data to guide their programs.
The NADP data has led to government initiatives in regulating emissions. Regulations in the power sector, especially for plants using fossil fuels, have helped achieve a 95% annual SO2 reduction and an 89% annual NOX reduction. The NTN has been cited in reports to Congress to demonstrate declines in acid found in rainwater.
The Xylom is an independent, nonprofit website whose work is written, reported, and owned by human journalists. Our intended audience is real people, not AI scrapers, bots, or a search algorithm; we don't take money from fossil fuel companies, lobbyists, or politicians either. Become a member to access exclusive events and free swag.
Benish notes that many states are particularly interested in mercury monitoring. “States want to keep track of the mercury concentrations in their regions,” she says.
Midwestern states such as Nebraska, Utah, and Colorado have much higher mercury concentrations, according to 2024 data. There are plans for a passive mercury monitoring network. Passive monitoring is done with simple devices that do not need electricity or any special equipment.
This supplements the active monitoring that researchers undertake to understand how mercury is impacting the environment, particularly foliage.
The National Park Service partners with NADP to issue air quality alerts based on mercury sampling, enabling citizens to avoid parks with poor air quality. For instance, NADP’s monitoring helped California’s Yosemite National Park issue an alert in 2019. Park visitors can view overall air quality trends throughout the years where data is available.
The data even helps citizens know if local fish are safe for consumption. It is also used to improve models and measure the impact of deposition reduction strategies over time.
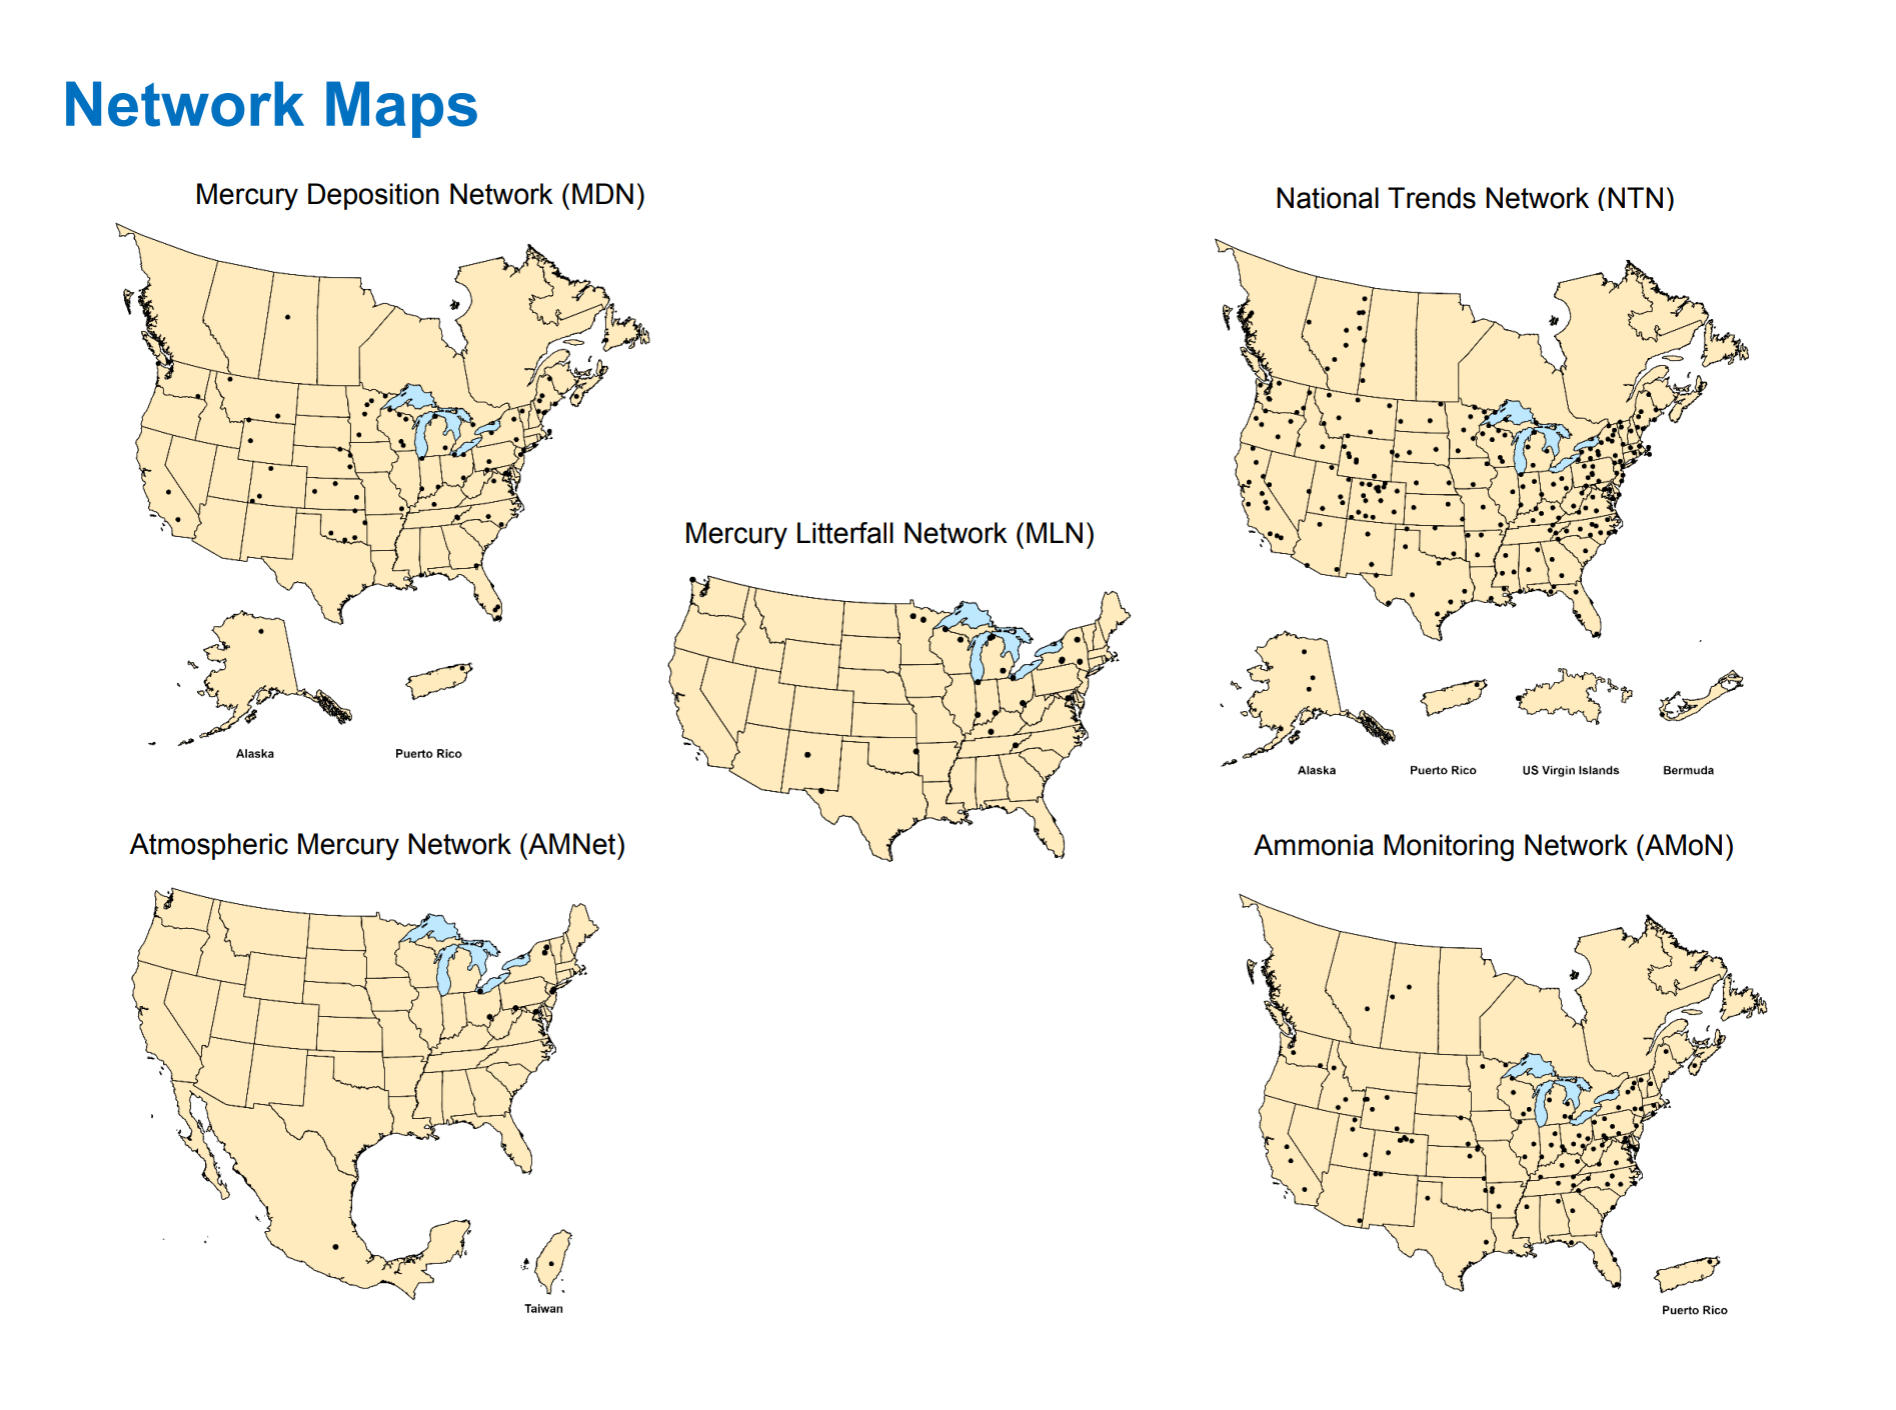
Many of the network sites are housed within research entities or universities and operated by dedicated staff. At other sites, collection at this scale is only possible with the help of dedicated subcontractors like Dreyer, referred to as site operators.
Dreyer has been making the Tuesday trek for more than 12 years now. Before retiring in June 2026, he was a communications and marketing manager at a craft educational center. Before him, his son Miles had been collecting precipitation data for years before suddenly passing away from a viral infection.
At first, Dreyer filled in so the site wouldn’t go dark; eventually, he realized that the monitoring work mattered to him.
“I just loved going up to the site and it was like a point of connection between me and my son,” he says.
Now he coordinates with a neighbor each month to designate who would collect samples in case the other is unable to.
Once Dreyer completes his mile-long hike, he reaches the top of Clingman’s Peak and begins taking measurements. He replaces the sample bucket that has been collecting precipitation since the previous week and takes detailed notes of any potential contaminants that may affect the data.
The rain gauge can only hold about 12 inches. Dreyer checks whether the gauge is likely to overflow when he comes back in a week’s time. Sometimes, there is ice in the gauge that needs to be removed.
“There are a bunch of categories of possible contamination: plant matter, insects, debris, contamination from the operator,” says Dreyer. “If I accidentally put my hand inside the bucket or touch the water somehow, that would be contamination from the operator.”
Depending on the collection network, the procedures and equipment can vary a lot. The collection buckets at an NTN site are separated into wet and dry. There is a motorized lid seal that moves the seal from the wet bucket to the dry bucket when precipitation is detected. The seal is also heated, so the dry bucket remains dry when not in use. Additionally, the lid seal prevents the contents of the wet bucket from evaporating before it can be measured.
Many sites, especially in the new PFAS subnetwork, require specialized equipment such as a PFAS-compatible lid seal.
In a Small Iowa Town, a Solution to a National Crisis
The Iowa Flood Center developed a low-cost flood monitoring system, which includes a $7,500 water gauge and predictive mapping tools backed by human experts, that's helped local officials in make better-informed decisions during flood emergencies. In 2024, the center helped rescue coordinators safely navigate boats to 300 stranded residents during a flood.
If collection equipment needs repairs, operators call a dedicated support line and are walked through repairs virtually.
While the collection sites vary greatly nationwide, all operators within a network follow the same protocols for data collection and measurements.
“This is true for all of NADP; once we have an SOP [standard operating procedure], it’s all standardized,” says Benish. “That’s what makes the data unique. You can compare site-to-site and year-to-year data.”
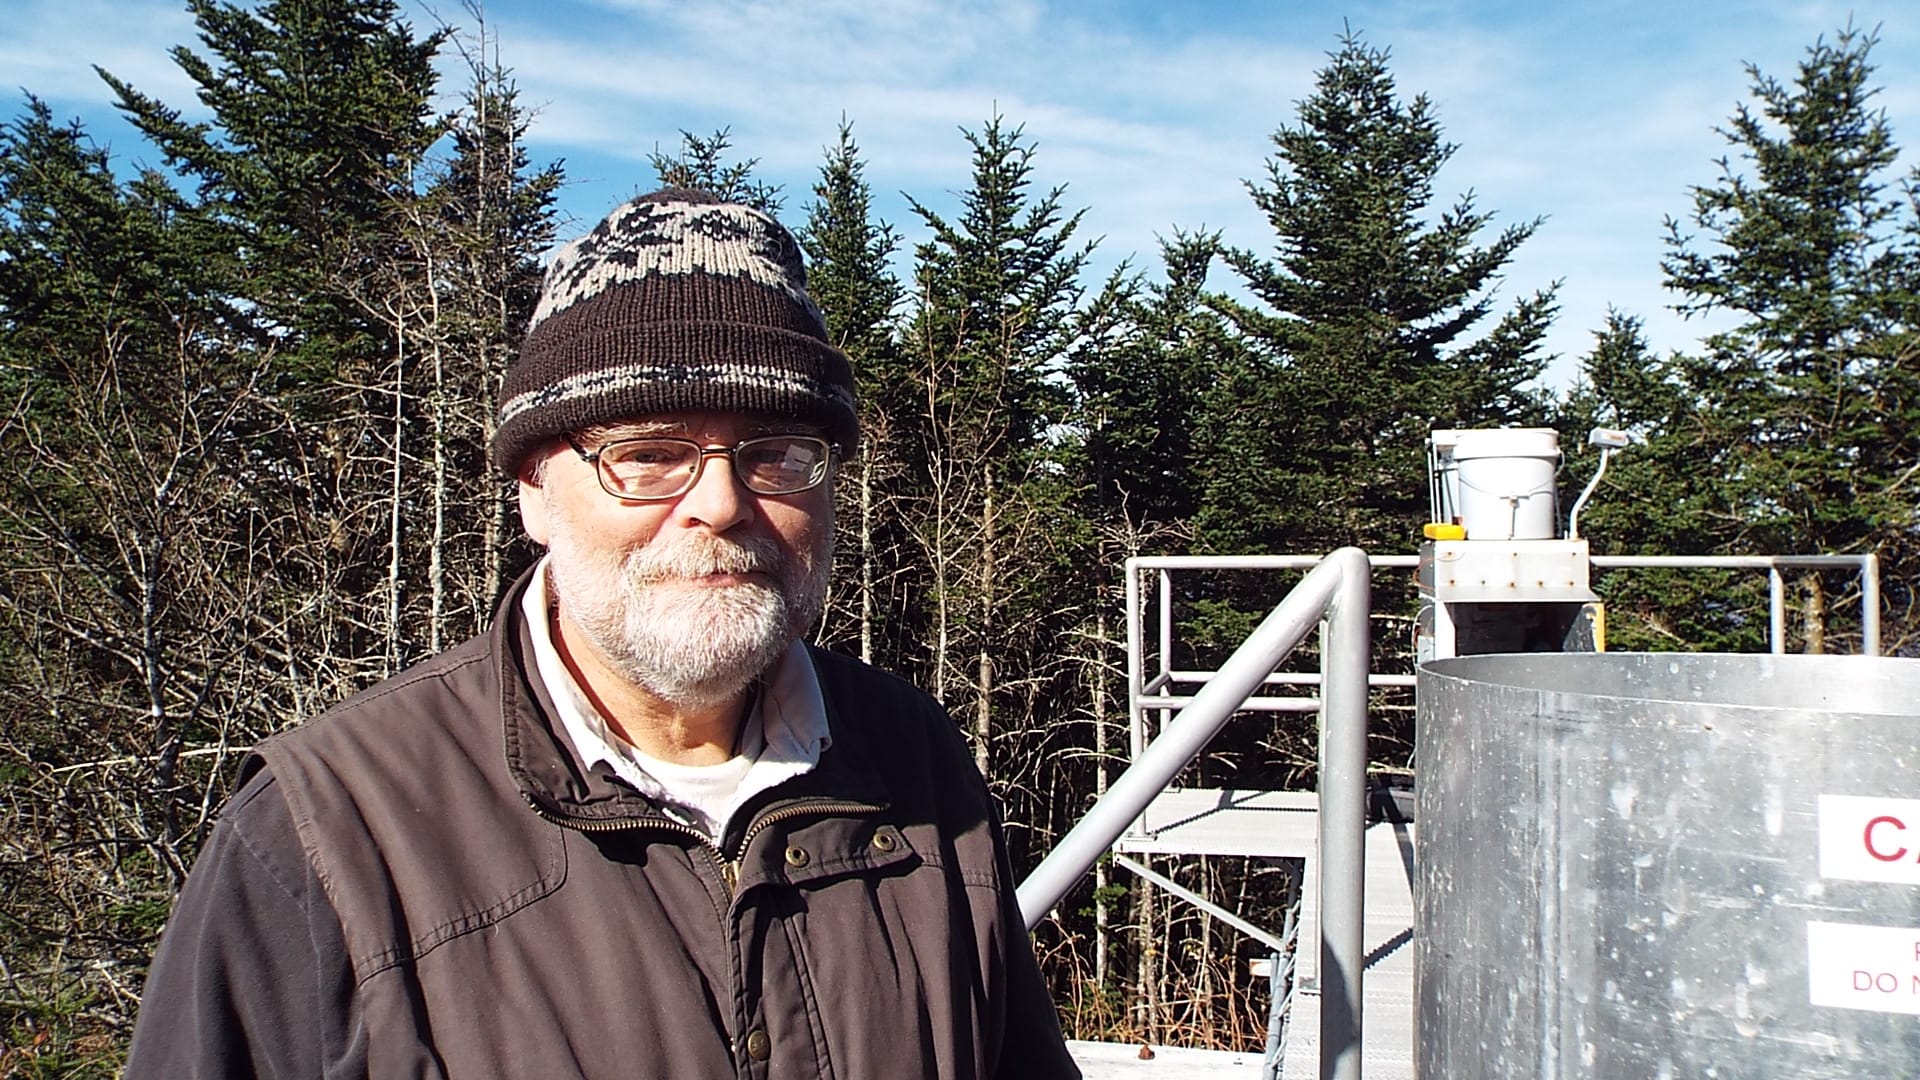
Dreyer says that many counts are measured down to the tenth, or even hundredth, of a gram depending on the measurement.
After operators log their weekly measurements, the samples are shipped to a central lab for analysis. Their readings are compared to the ones logged by the field equipment, and any discrepancies are noted. Everything, down to the empty sample buckets, is weighed to ensure week-to-week consistency.
The PFAS subnetwork, which began as a pilot program in 2017, offers new insights. The amount of PFAS found in deposition indicates people’s daily exposure to these chemicals, helping inform mitigation efforts. Currently, there are 18 sites actively collecting PFAS deposition data.
“It’s very hard to measure PFAS at low levels when they’re already low in things like rain,” says Benish. “But we’re finding that deposition is a key pathway for delivering PFAS to the environment.”
The Xylom is an independent nonprofit. We have no owners or shareholders, no corporate interests, and no government contracts. We have no paywalls. Everything we publish is free. Join our community of members and cancel anytime.
The data from these samples hasn’t been released yet, but many of NADP’s clients, especially academics and industry professionals, are interested in it. They hope that the data will help reduce PFAS pollution.
As Benish says, “Support for long-term monitoring… is really important to protect human health and the environment.”